

Sydney Weather Forecasting
Background
Weather forecasting is the application of science and technology to predict the conditions of the atmosphere for a given location and time, it relates closely to Production activities, social activities and daily activities. Forecasting weather requires interdisciplinary knowledge. Traditionally, the weather forecasting models were made by collecting as much data as possible about the current state of the atmosphere (temperature, humidity, rainfall meteorology understanding and wind), this processing can be complicated and only valid to short term forecasting.
In this project, we applied time series analysis models to resolve the long term weather forecasting challenge. More details about the VAR/VARMA/LSTM models and the model evaluation and discussion are included in the report.
Exploratory Data Analysis
The original data include 72588 observations of 46 different weather stations recordings, which was extracted from the bureau of the Australia meteorology with date from 2013-03-01 to 2017-06-25. Missing data is imputed with linear Interpolation Imputation.
A shiny App was developed here.
Methods and Discussions
-
VAR(Vector Autoregression)
A linear model designed for multivariate time series. It’s a generalization of the AR(Autoregression) model by including the capture of the linear interdependencies among multiple time series. A baseline model and a VAR with the seasonal dummy terms are modeled in this study where the order of time series models is determined with AIC/HQ/SC/FPE.
-
Model Diagnose
Model assumption(Correlation/Heteroscedasticity/Normality) were validated.
-
LSTM(Long Short Term Memory Neural Network)
Long Short Term Memory (LSTM) networks are a special Recurrent Neural Network (RNN) that are capable of learning long-term dependencies. Here it was applied for leveraging the multivariate time series modeling problem.
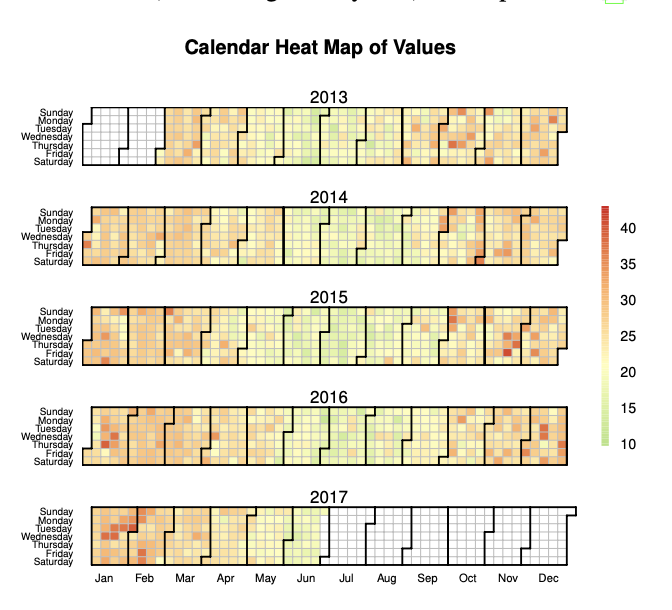
In the Exploratory Data Analysis part, I applied several visualizations and analysis to better understand the raw data.
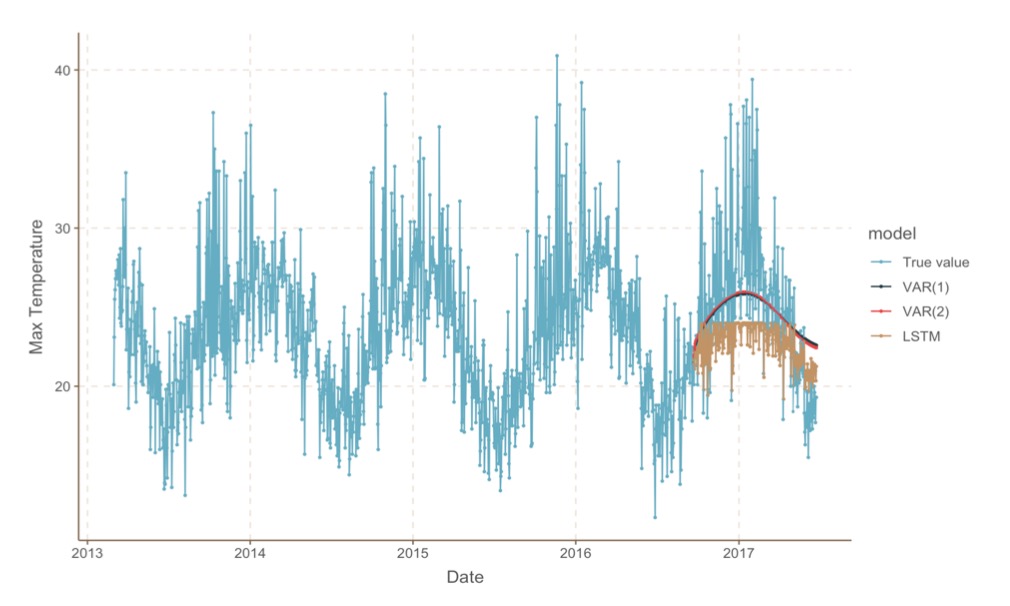
LSTM model forecasting and the VAR(order 1/order 2) are demostrated as right, blue curve is the true value. VAR(1) has the best perfomance considering the model complexity and accuracy.